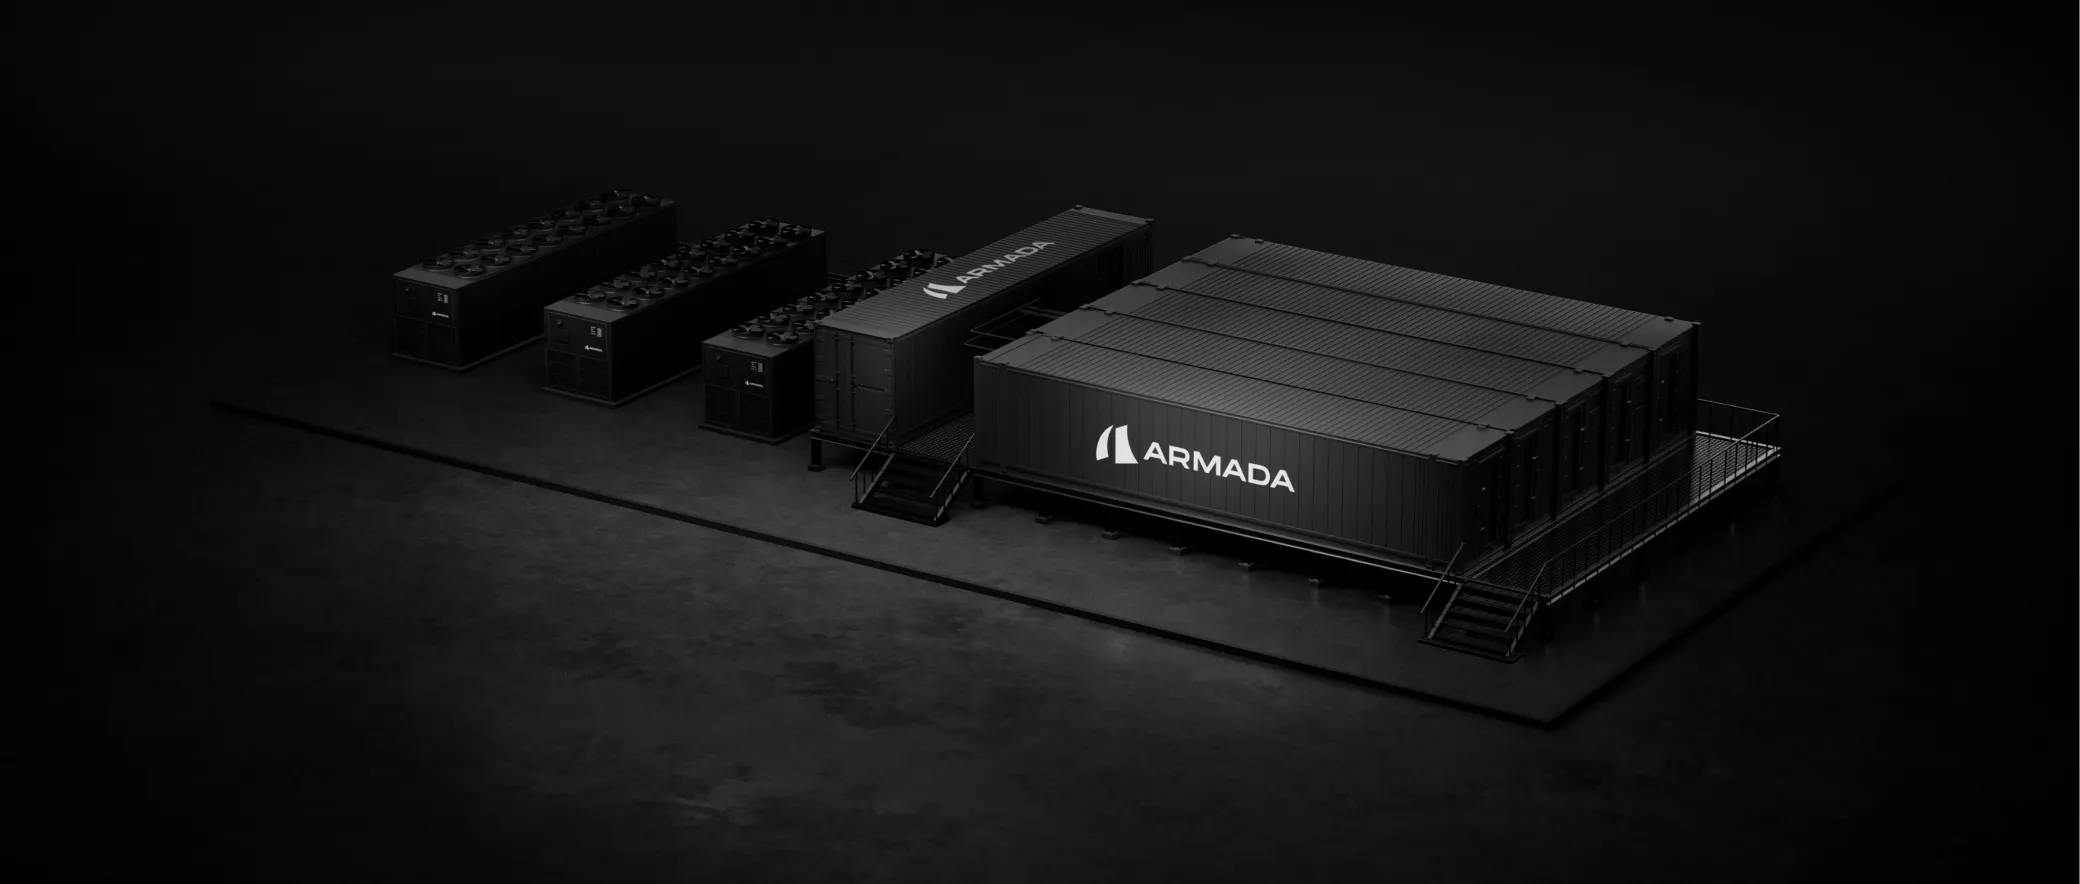

Reframing a core feature after watching users skip it

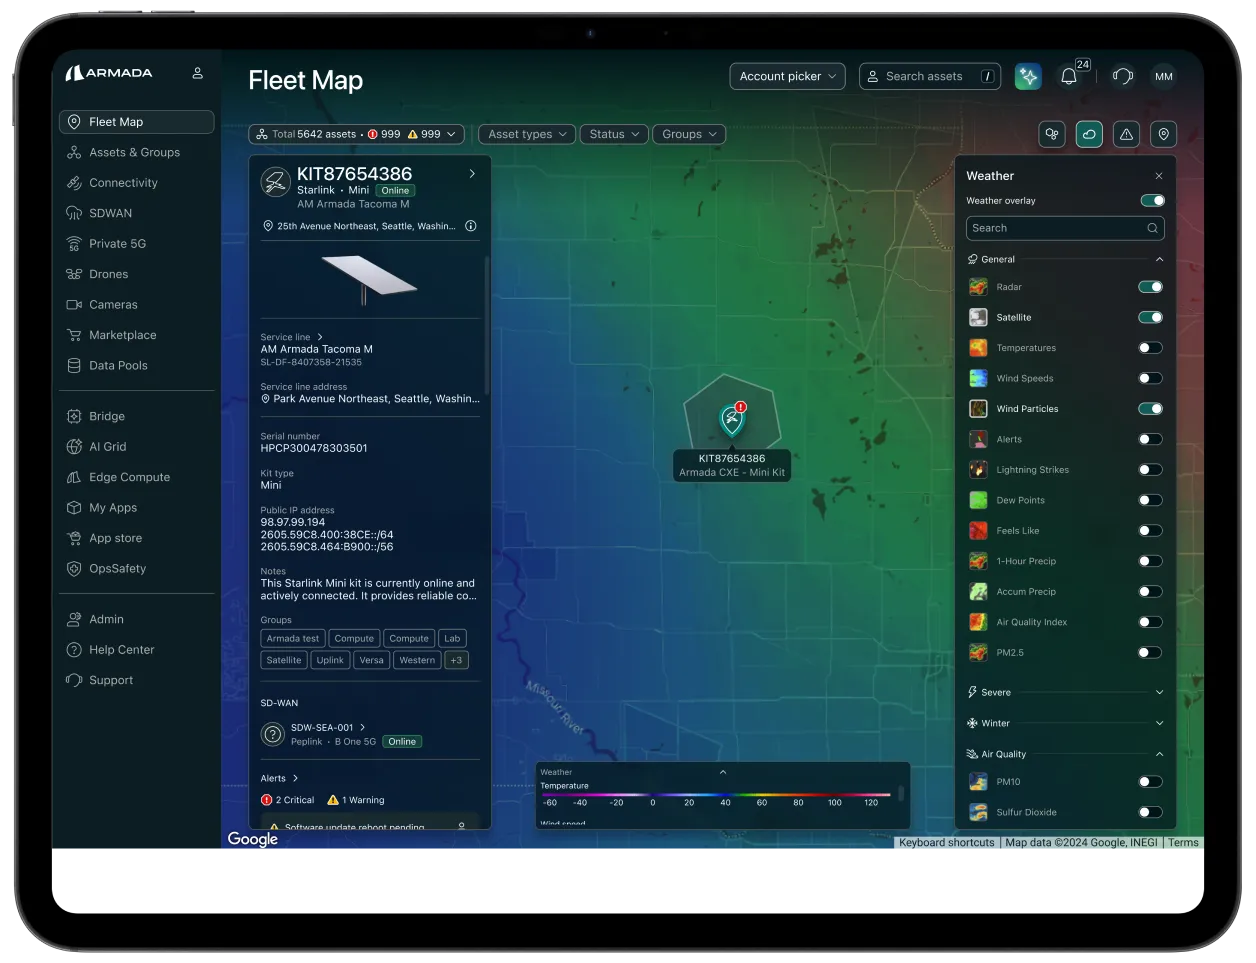
What Fleet Map is
Fleet Map is the screen operators open to see every piece of connected hardware they manage — where it is in the world, whether it’s working, and what needs attention right now.
It sits inside Atlas, Armada’s platform for monitoring edge infrastructure. Atlas is one of four products in the Armada Edge Platform — alongside Galleon (ruggedized mobile data centers), Leviathan (GPU-dense super intelligence infrastructure), and Bridge (GPU-as-a-Service for sovereign cloud). The platform runs across 100+ countries, with 2,000+ enterprise users and 30,000+ connected assets.
The screen where thousands of connected devices become one view. I own the design of Fleet Map end-to-end — shipped V1, studied how real customers used it, and am currently leading V2.

The design problem
Fleet Map was part of Atlas’s visual identity before it was part of its operational core. It plotted customer assets on a world map by address. That was the entire function. Open the map, see where things were. Close the map, do your actual work somewhere else in Atlas.
For sales, Fleet Map worked. It was visually compelling, globally scaled, exactly what a demo needs. For operators doing real work, it was decorative.
Visually sellable. Operationally hollow.
My job was to close that gap
To turn Fleet Map from a demonstration of what Atlas monitored into a working surface for how operators monitor it. Specifically, that meant giving operators three things the V1 map didn’t:
Spatial awareness that actually tells them something
Movement in real time
Context between assets and their environment
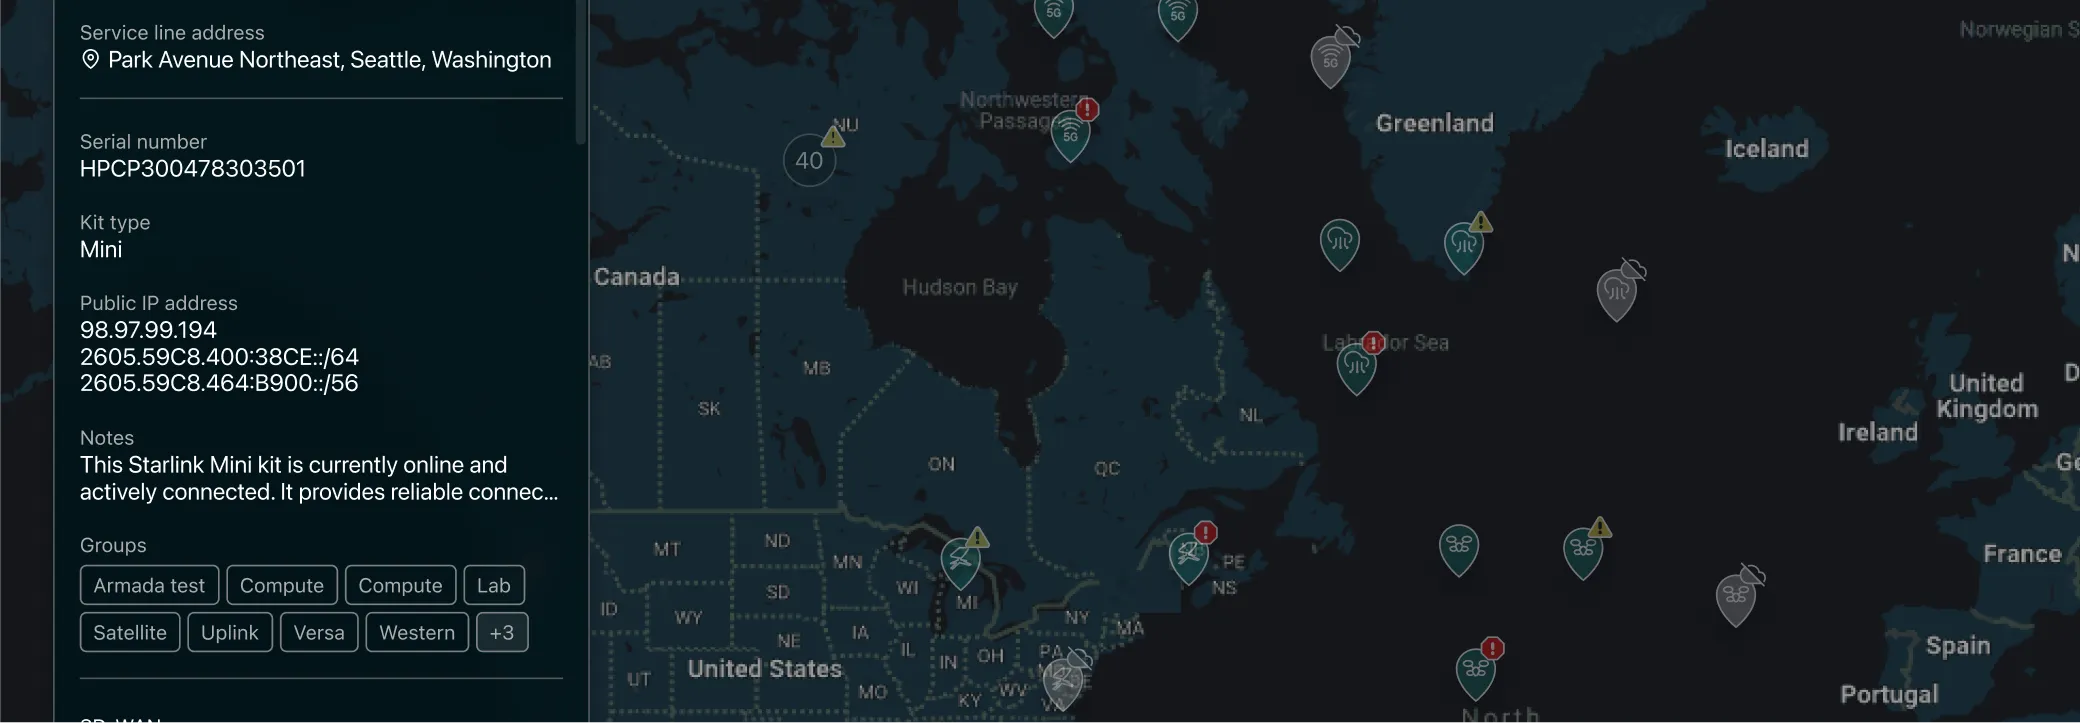


The question I pushed to ask
Before V2 planning started, the team had the next round of features scoped. More filters. Richer tooltips. Additional layers. All reasonable things to add if V1 was already working.
Before adding more to a feature that wasn’t doing much work, I wanted to understand what operators were actually doing with it. Not what we assumed. Not what the mocks implied. What the sessions showed.
Before building the next layer, I wanted to see what was happening on the current one.
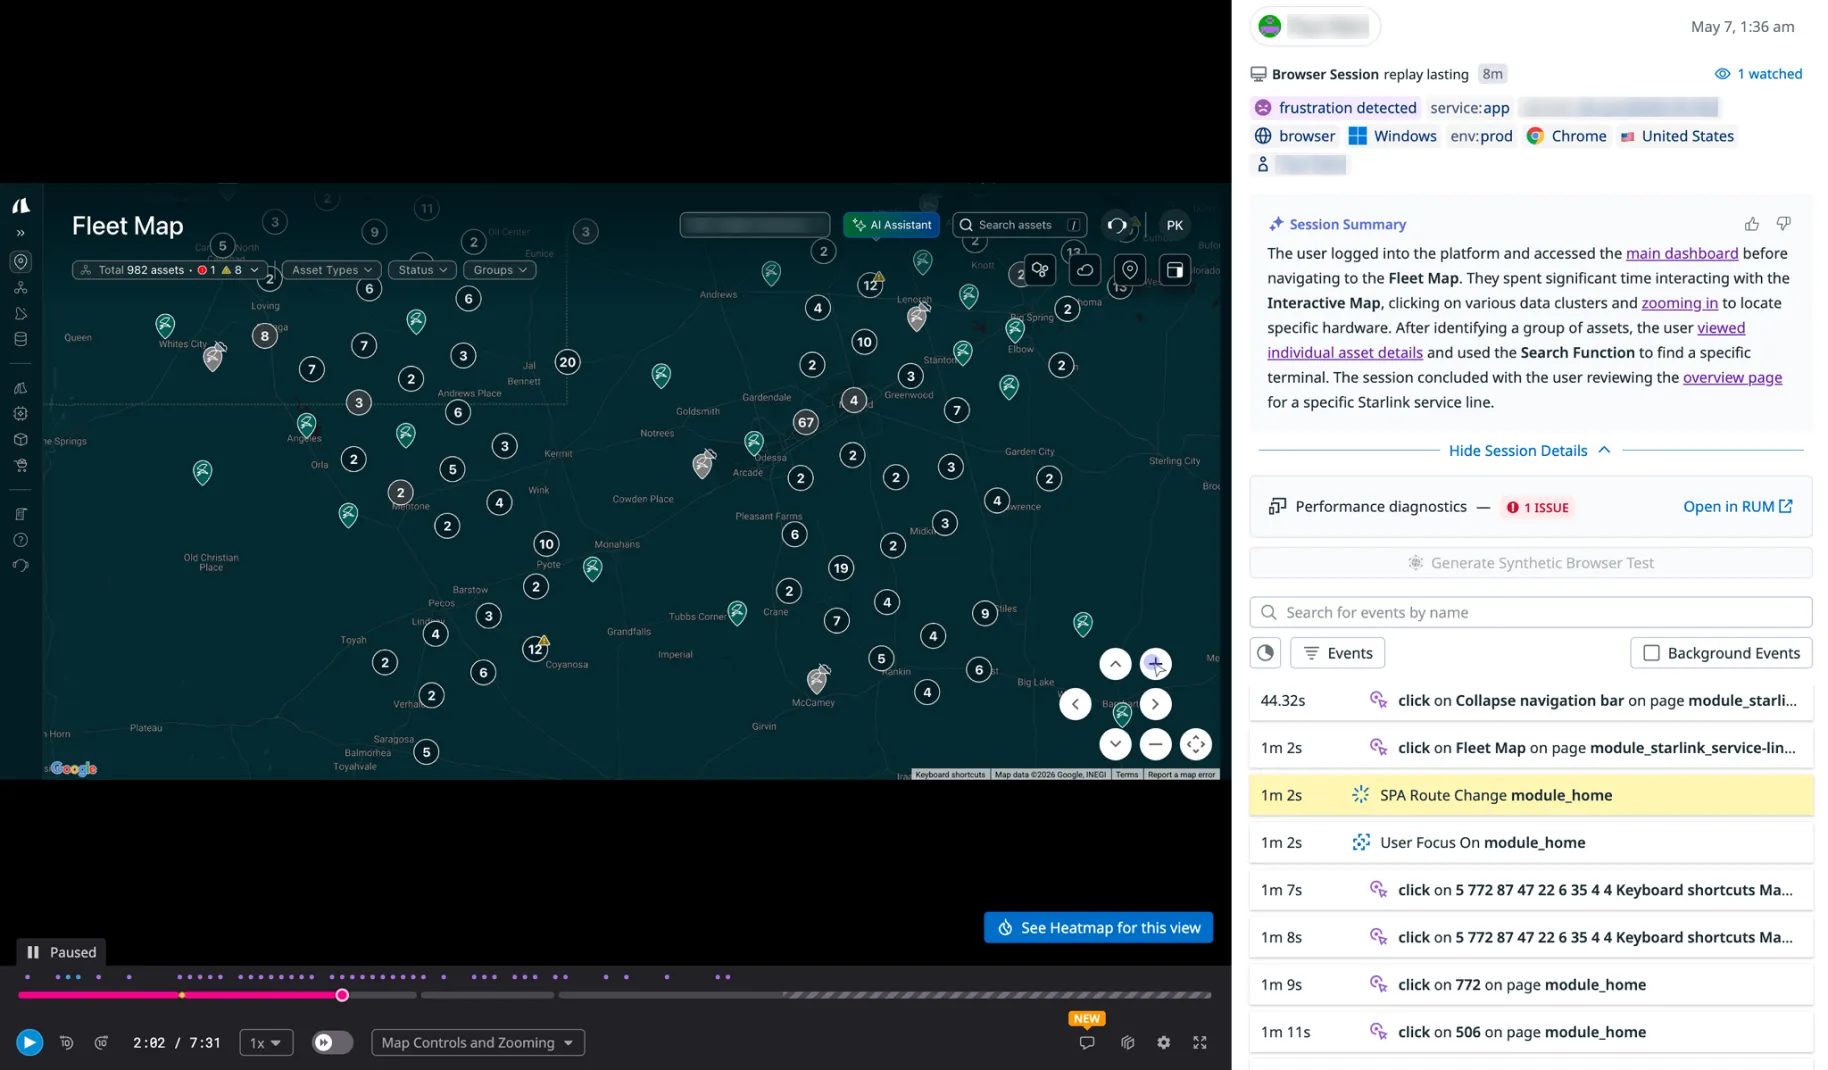
Ran a qualitative behavioural analysis using Datadog session replays across multiple customer accounts
Measured the actual sequence of clicks, hovers, scrolls, and abandonments inside Fleet Map. Not survey data. Not what users said they did. What they did.
What the research showed
The pattern across sessions was consistent. Fleet Map wasn’t competing with other tools in Atlas for operator attention. It wasn’t losing to Global Search. It was simply skipped because there was nothing in it worth stopping for.
Fleet Map wasn’t broken. It was hollow — there was nothing worth staying for.
Operators went straight to Global Search
When they did open it, they were verifying, not discovering
Customers with small fleets skipped the map altogether
The asset detail page was where operators actually worked
Taken together, the research confirmed what the three gaps from section 2 implied all along. Spatial awareness, real-time movement, environmental context. V2 would be built around closing them.
What changed in V2
V2 wasn’t a redesign. It was a repositioning — Fleet Map stopped being a static plot of asset locations and became a working surface for monitoring distributed hardware in real time.
Not a redesign. A repositioning.

Closing the spatial awareness gap
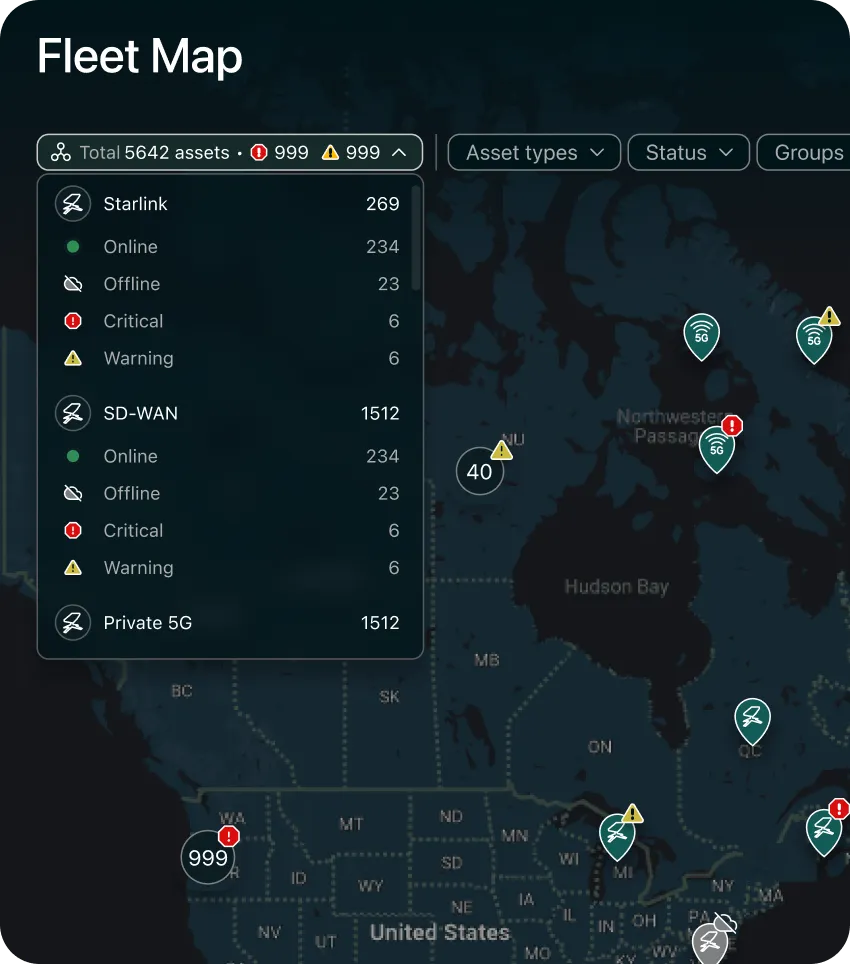
The opening shifted from “narrow this down” to “here’s the shape of your operation.” V1 opened with a filter bar, asking operators to narrow before they’d seen anything. V2 opens with a summary of state — total assets, critical alerts, counts of what needs attention. The map stops asking for work before it offers something.
A live asset count panel
Provides a persistent health readout that updates with filters — Fleet Map now reads the state of the fleet before an operator zooms into any specific part.
Hover became a working interaction, not a preview
Categorized information assets grouped by type and status, with the ability to filter from inside the hover itself.
Closing the real-time movement gap
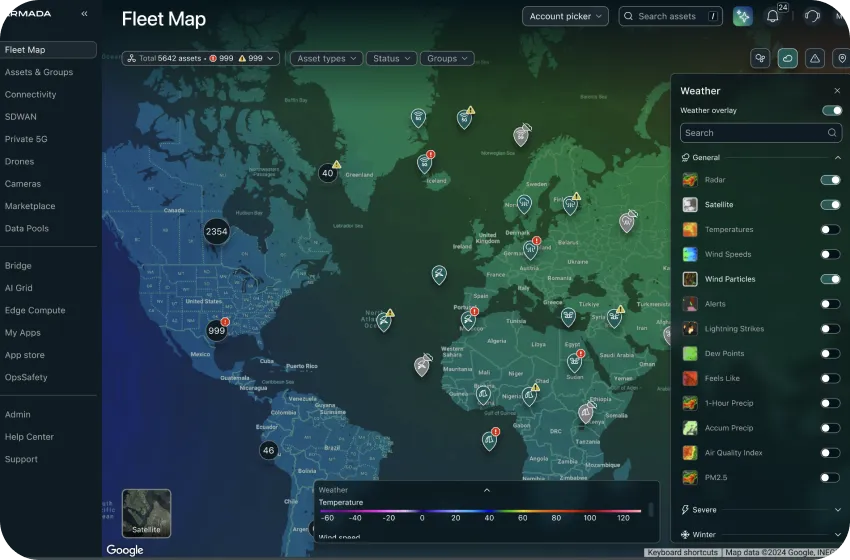
Information scales with zoom and attention. Clusters resolve into individual assets as operators zoom in. Live status and operational signals surface at the level of detail that matters at each scale.
Closing the environmental context gap
Real-time weather, correlated with device performance. Categorized information assets grouped by type and status, with the ability to filter from inside the hover itself.
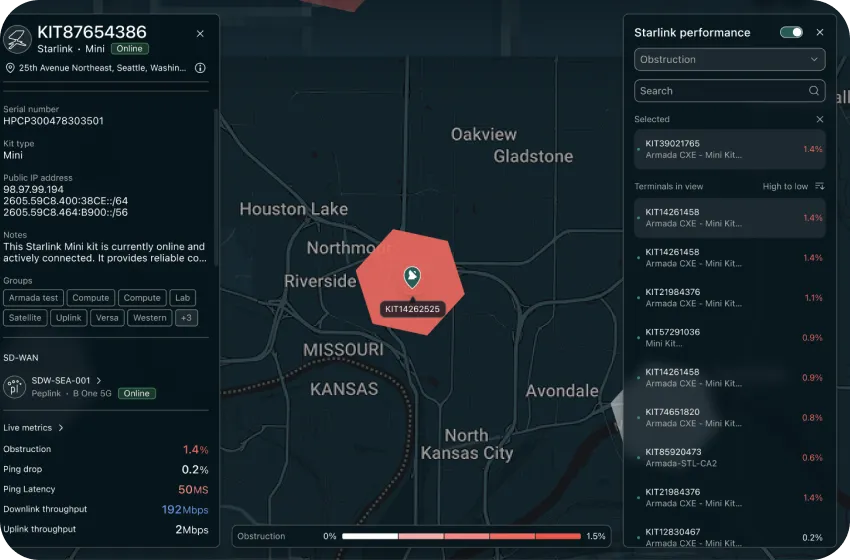
Starlink performance heatmap
Uses H3 hexagonal grids to show terminal performance patterns across a region. Patterns tell a story that individual asset status can’t.
V2 turned Fleet Map from a plotting tool into a sense-making one.
What the data showed after V2
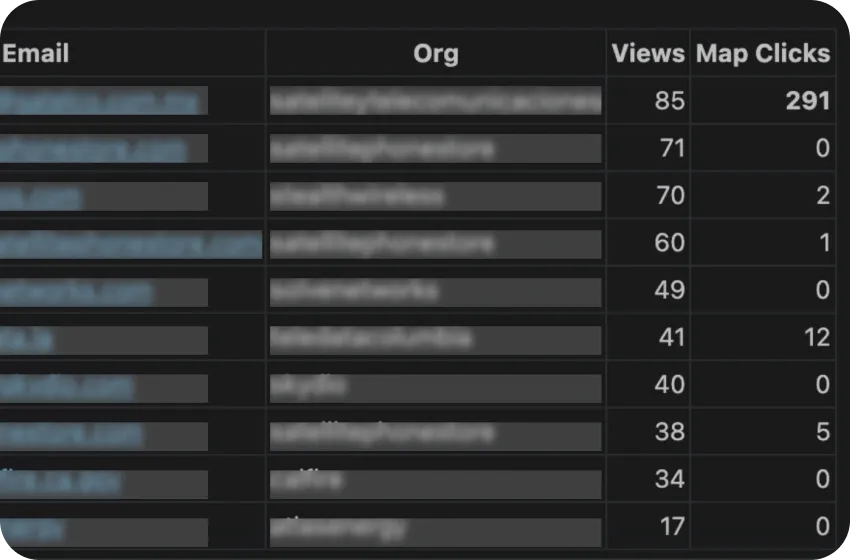
A month into V2, I ran an engagement and adoption evaluation across the three features designed to close the environmental context and spatial awareness gaps. The data confirmed what the reframe was built on — operators were using the layers that mattered to their operational reality, and using them in the way the research had predicted.
What customers did
Over 360 interactions across 25+ enterprise customers in a month — on features that had been built around a specific hypothesis about what operators needed.
Adoption confirmed the reframe. Fleet Map was being used because it was useful.
How they used it
The behavioural pattern inside the sessions was more interesting than the volume. Operators weren’t toggling weather because it was there. They were toggling it in direct relation to asset performance — turning on weather layers when assets showed degraded connectivity or operational signals. The environmental context gap identified in section 2 wasn’t a hypothesis anymore. It was the live use case.
Operators were using weather as a diagnostic layer, not a decorative one.
What's still friction
The adoption evaluation also surfaced friction.
Switching between metric toggles felt sluggish — operators lost context moving between measurements
The H3 overlay had no visible dismiss control, so operators who closed the panel had no way to turn the overlay off without reopening it
Several replays showed operators clicking the heatmap toolbar button expecting it to toggle the overlay off, when it was actually meant to open the panel
Phase 2 is where I’d address this — making the overlay directly dismissable, surfacing metric switching inline on the map, and treating the panel as a settings surface rather than a required control plane.